Step 1: Log Into Your Dashboard
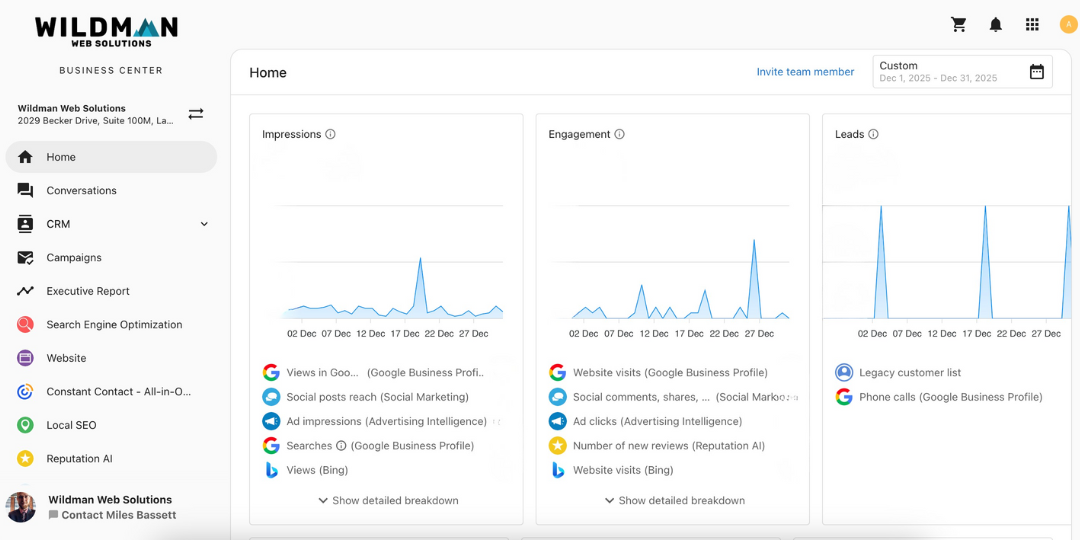
When you log into your Wildman Dashboard, the Executive Report is the first thing you’ll see. This report gives you a high-level overview of how your website and marketing efforts are performing in one place.

Step 2: Review the Executive Report on the Home Screen
From the home screen, you’ll see a snapshot of your overall performance. This overview is designed to help you quickly understand how things are going without digging into individual tools.
Key metrics you may see include:
- Impressions
- Engagement
- Leads
If your account is brand new, you may not see much data yet. That’s normal. As your products are connected and your marketing runs over time, this report will continue to fill in with more meaningful information.
Step 3: Open the Full Executive Report
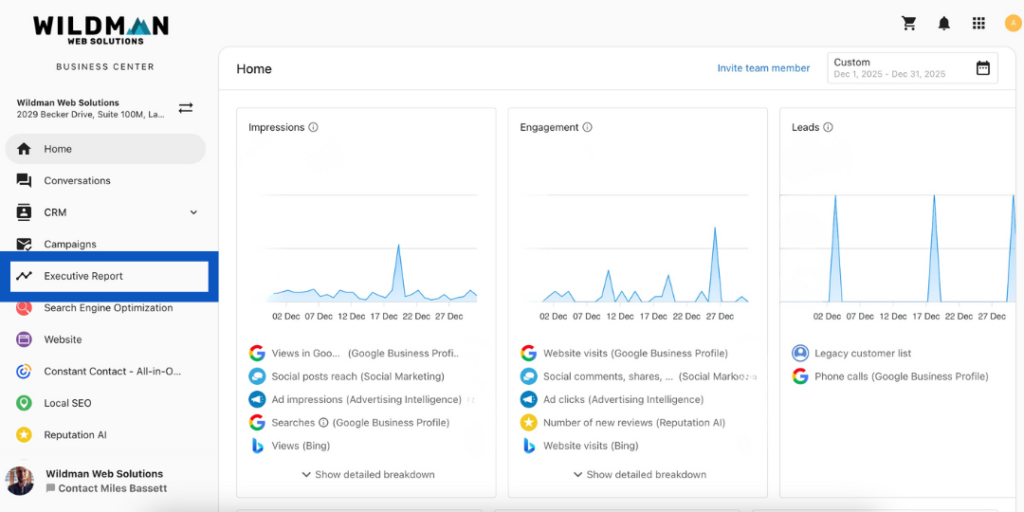
To see more detailed data, click “Executive Report” in the left-hand menu.
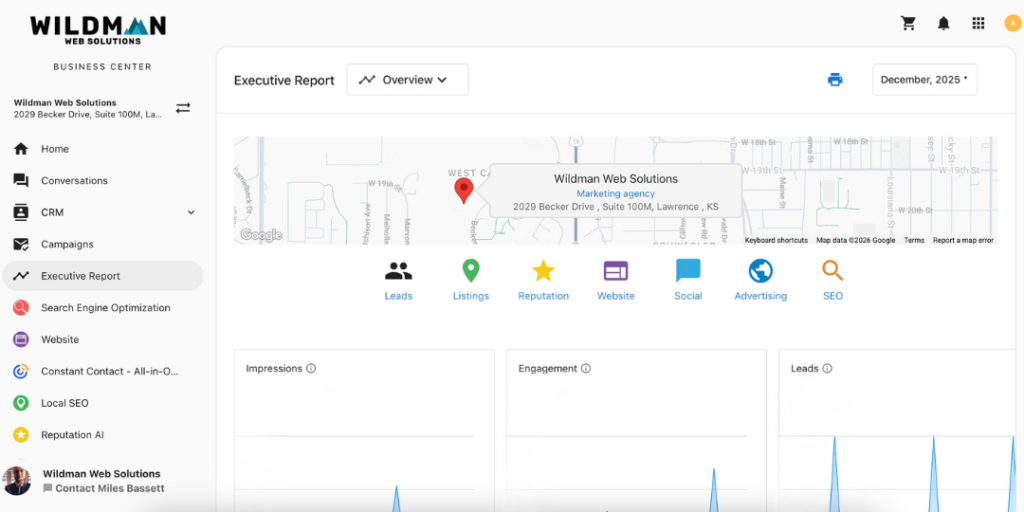
This view expands on what you see on the home screen and gives you a clearer picture of performance across everything that’s been set up for you.
Keep in mind: the more products you have connected—and the more up-to-date business information available—the more data this report can show.
Step 4: Change the Date Range
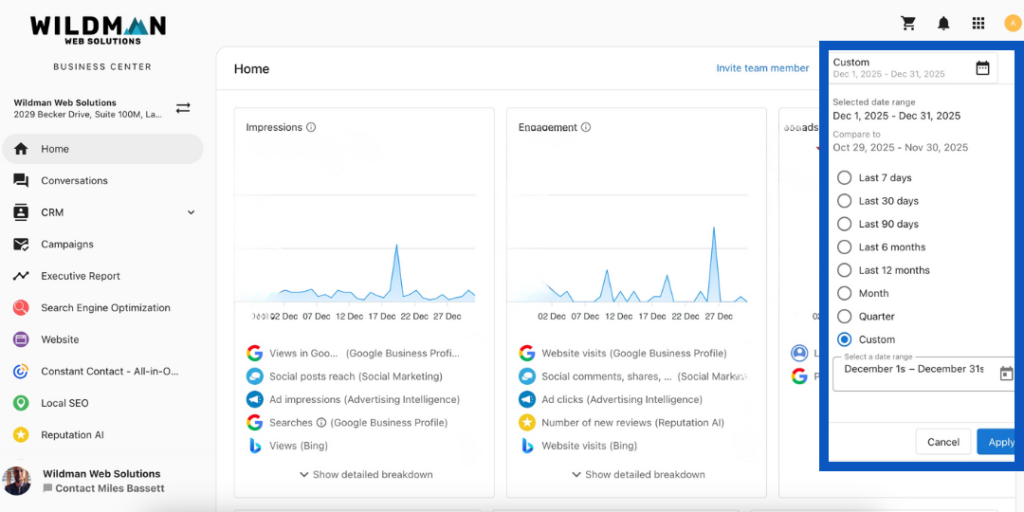
You can adjust the reporting period using the date range selector in the top right corner of both the home screen and the full Executive Report, allowing you to review your data over longer or shorter periods of time.
What to Expect Over Time
Your Executive Report will grow as your account grows. As additional products are connected and data accumulates, you’ll see clearer trends and stronger insights into what’s working for your business.